
Features
Each image object has a number of characteristics such as spectral, geometric, spatial, topological and hierarchical. These characteristic attributes are called features in eCognition and can be visualized and applied with the help of the Feature View dialog - once image objects are created. Features can be compared to a mathematical property or function. For each image object, a certain value is calculated based on this function. This characteristic and measurable property of an image object, e.g. its color, texture or its compactness (shape feature) is used in classification.
eCognition has a very rich selection of available features that can serve as an extremely powerful tool for image analysis. It is crucial to choose a discriminating feature (or subset of features) for an effective and successful classification.
The values depend on many factors such as the imaging system, the spatial and radiometric resolution, atmospheric and seasonal conditions.
Based on the feature value an object can be assigned to a certain class. An exemplary formulation is: classify all image objects with a low reflectance value in the NIR channel as Water.
On the one hand, in eCognition classification is based on these so-called features - attributes extracted from an image, image object or other layers of information, thus image objects can be assigned to a certain class based on a user-defined feature value range or on a certain feature value. On the other hand, new features can be created and calculated by the user or combined for a specific classification process, called customized features.
Once you have created image objects you can visualize feature values based on Tools > Feature View.
Feature View dialog 
The Feature View can be used after a first segmentation. You can then select a feature in the Feature tree by double-clicking on it. Image or vector objects are displayed in grayscale according to the feature selected. Low feature values are darker, while high values are brighter. If an object is visualized in red it is not defined for the feature.
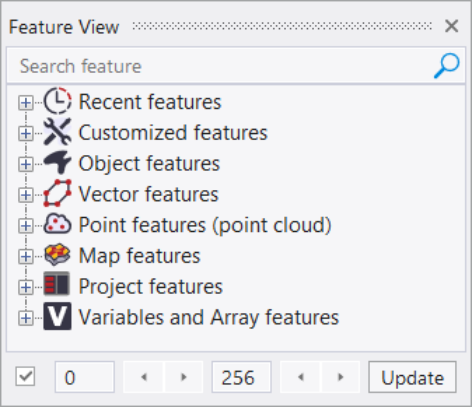
Search feature
The Search feature field is located in the upper part of the Feature View dialog. You can start typing a feature name in the Search feature field and the dialog will list all search results.
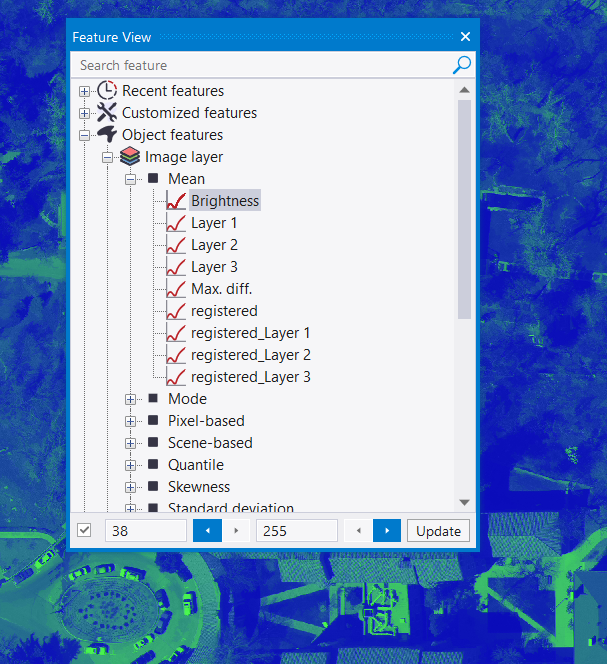
Show range and Update button
In the lower part of the dialog your can find a check box to activate a color ramp for the visualization of feature values.
- Activate the check box 'Show range - graduated color' in the lower-left corner of the dialog.
- For the active feature, the image objects are now visualized from blue to green - blue representing low values and green representing high values. You can adapt the visualized range by inserting different values for the upper and lower border and by that you stretch a certain range of objects to this blue to green color ramp.
- Note that extreme values (outliers) are sometimes not covered by the range calculation and appear in black (minimum) and white (maximum) respectively. If an object is visualized in red, it is not defined for the feature.
- Click the Update button in the lower-right corner of the dialog to update the range each time you select a new feature by double-clicking in the feature tree. Alternatively, you can right-click the feature and select Calculate Feature Range in the context menu.
- If you insert a different value using your keyboard e.g. for the upper threshold, click the Update button to refresh the view based on the inserted value. Alternatively, click Tab or Enter or you can click in the lower threshold field to apply the new threshold. Each time you change one of the values and click the Update button the view is updated with these new values. If you do not change a value and click the update button again, the full range of the feature is visualized.
- Additionally, you can use the small arrows beside the threshold windows to adjust your 'colored' interval step by step.
- Deactivate the check box again to switch back to a grayscale visualization of your feature.
Feature Tree - Main groups
The list of features implemented in eCognition by default is very large. Additionally, you can implement your own features using the customized feature tool Customized features > Create new 'Arithmetic Feature'.
eCognitions features are grouped in these main sections:
- Recent features
- Customized features
- Object features
- Vector features
- Point features (point cloud)
- Map features
- Project features
- Variables and Array features
This chapter explains the major groups of the Feature View dialog. The following chapters explain each feature in more detail together with its calculation and some basics in the conversion of values.
Recent features 
Shows the history of the last features used in the project session.
Customized features 
Calculate your own relationships between objects or simple arithmetic features based on existing features. These do-it-yourself features can be arithmetic or relational features. The relation can be to either neighboring objects of a set of classes, sub- or super objects or a defined level. Example: simple indices like NDVI or advanced relational features comparing objects for a feature to a certain class or surrounding (mean difference to lower values for the elevation of an object in a defined radius). You can right-click in the Feature View dialog and select Manage Customized Features or go to Tools > Manage Customized Features > Add).
Object features 
This group includes spectral characteristics of objects derived from image layers as well as spatial, geometric and topological characteristics all of which can be used at any step of the classification process.
Examples: mean in red, green, blue channel, brightness in all channels, HSI transformation, area, mean difference to neighbor objects. Point cloud features in this group are calculated from point clouds based on objects.
Vector features 
Features based on vectors objects (not image objects). They allow addressing vectors by their attributes.
Point features (point cloud) 
Features of this group are calculated for each single point of the point cloud (not image objects, see also group Object features > Point cloud that covers points cloud attributes per image object). Example: X, Y, Z coordinate of a point or image layer value that corresponds to a point cloud point.
Map features 
These features are calculated based on a defined map. (A map is a subset of the loaded scene or a downsampled scene, more than one map can be created within a project). This group of features includes for instance map origin (X/Y), standard deviation in region or min/max (smallest/largest actual pixel value) within the map.
Project features 
Comprises all features related to the project and its infrastructure in the broadest sense.
For example information on the workspace, rule set, maps or deep learning model (convolutional neural network model info) but also eCognition Architect parameters or viewer settings.
Variables and Array features 
Define individual variables or arrays containing multiple variables. This is a very powerful group of features to write transferable rule sets automating image analysis.
Examples: Use variables...
... to adapt rule sets automatically based on minimum and maximum values,
... to calculate and update classification thresholds that differ per scene or
... to store classes in an array and loop through the elements until all elements are executed.
